Teknologi / 12 minutter /
User Behaviour Analysis (UBA)
User behavior analysis (UBA) is the set of methods/techniques/mindset for collecting, combining, and analyzing quantitative and qualitative user data to understand how users interact with a product, and why. In our case it is the banking product e.g., credit card.
Why are users doing what they are doing and how to make sense out of it? Tracking collecting and assessing of users data and activities at the same time using Machine learning techniques.

User behaviour
The user behaviour encompasses all the actions users take on a product: where and what they click on (in terms of transactions), how they move from one state to another (being active to inactive), where they stumble, and where they eventually drop off and leave.

User shopping behaviour
Tracking
Tracking and monitoring users behaviour gives one an inside look at how people interact with your product (credit card for example) and what obstacles or hooks they experience in their journey as your customers.
Analyses
(UBA) is a tailored method for collecting, combining, and analyzing quantitatively and qualitatively users data to understand how users interact with a product, and why.
When you want an answer to pressing business/research questions such as “why are users coming to my product/services?” or “why are they leaving or not coming?” Traditional analytics alone can tell you that quantitative activity is happening, but can’t really give you any of the ‘whys’. That's where user behavior analyses comes in, with specific tools and techniques that help you get a full picture of user behavior.
Demographics information
Cluster users together into groups which can help understand the users. And also target the specific cluster of the users. Who the users are? And consequently how the products and services should be.
Retention
How regularly do they use the product?
Engagement
How much time do they spend in your product? How engaged they are with the new product or services?
Average Revenue
And finally how much they spend or how much worthy a single user is to the business model.
How - it's all about events!
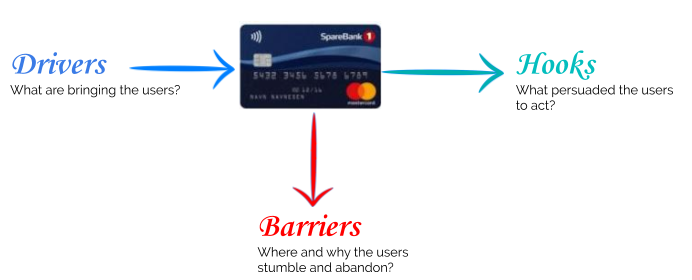
Drivers, hooks and barriers in the user behaviour life-cycle
It is the drivers which bring a user to the product. The driver could be an advertisement campaign. And once the users embrace the product what are the hooks which persuaded them to continue using the product. And in this whole entire process what are the barriers, where and why are users abandoning the product and its usage.
Benefits
Get real, first-hand insight into what people are interested in, gravitating towards, or ignoring.
- Verify and validate the hypothesis
- How specific user needs change over time
- Investigate how specific flow and sections are performing
- Understand what your customers want and care about and subsequently align the product and avail the opportunities
In a nutshell, find an answer to the core question of user satisfaction.
Machine Learning and UBA
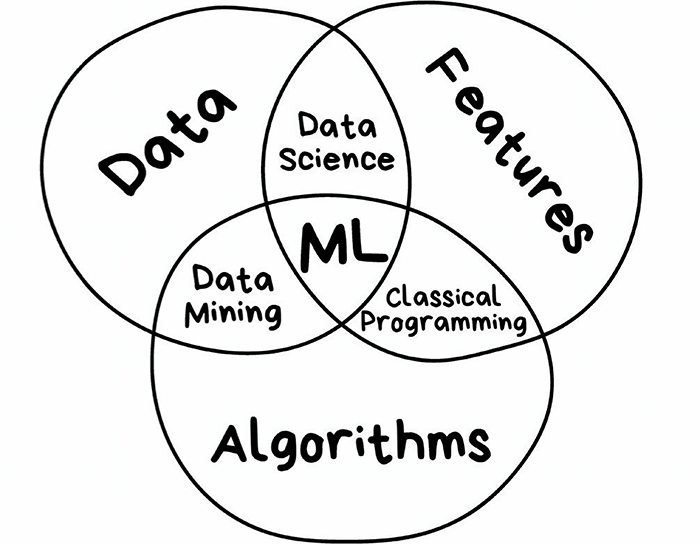
Machine learning venn-diagram. Image from towardsdatascience
Machine learning venn-diagram. Image from towardsdatascience
The machine learning black box helps in the UBA case as well. Here are some of the benefits of using ML.
- Self adjusted dynamic behaviour pattern
- Find hidden pattern in user behaviour
- Escape postmortem rules and signatures (not a viable solution)
- Detect unknown patterns and make it visible and usable for unfolding users’ intent
- Behavioral profiles
Still needs expert knowledge and human intervention
The Ingredients of ML for UBA
ML Tasks: Given right data and right parameters and time the ML algorithms give results usually with good enough accuracy. Some of the popular ML algorithms used for UBA are:
- Clustering
- Regression
- Classification
- Anomaly detection
- ...
Learning pattern from data: Learn from seen data, the training set favourably labelled, to predict unseen data, the live data. Learning algorithm can be categorized as below:
- Supervised learning
- Unsupervised learning
- Semi-supervised learning with tips from data and human
- Reinforcement learning with performance feedback loop
- ...
ML model: The snapshot of all trained algorithms, parameters (hyperparameters and trained-parameters), features and environments. Most of the time spent in creating the model is on tuning params not developing it. Following key steps are useful to know:
- Feature extraction and engineering (best set of features, requires domain expert knowledge)
- Model parameters (learned)
- Model hyperparameters (architecture)
ML features can have different forms:
- Categorical
- Statistical
- Empirical
- Continuous
- Binary
- ...
Architecture (global or hyper parameters that define high level behavior of neural network, in other words translating domain expert knowledge into numbers and algorithms)
- Number of Layers, number of Neurons, Activation function, Loss function, Optimizer, ...
Data (how the data is cooked)
- Features, Knowledge base, Sequence length, Normalization, ...
Training (how we see the results and tune accuracy, evaluations)
- Epochs, Bach size, Threshold, Distance, Smoothing, …
It's all about matrices
User profile data is stored usually in the form of a matrix. Which captures the users interests on different scales and items. The matrix in its nutshell represents the complex tree structure of users and items.
It is actually the reverse search:
User profile and item profile - user features, item features and joint features using matrix factorizations (collaborative filtering). Feed these to the learning algorithm and let it predict the possibility of the user purchasing an item.
Cluster the users and cluster the items and see the correlation of user clusters with item clusters. Novel? or a good way of discovering users' interest in items. Yet:
Data is the centre
Despite all its simplicity and basic status, data is above all other things the centre of everything in the picture laid out so far. Following data sources and format can and should be usable:
- Data Sources (all direct or indirect information available)
- APIs
- Logs
- Databases
- Log archives
- Log management tools (e.g., humio)
- Monitoring tools (e.g., prometheus)
- …
- Data formats (json, csv, tsv, ...)
- Syslog
- Key-value sources
- Distributed file formats like hadoop file system
...
The data as it comes from the sources are noisy, non-conformant, at different scale and non-normalized. Data normalization is a necessary post-process after acquiring the data. Which consequently helps understand the data sources and formats. The purpose of data normalization could be:
- Bring all formats to the same convention
- Find duplicate and missing fields
- One action generates several entries
- User do not enter a field in the application
From the data points in the data acquiring phase, there are data points depicting un-normal or deviant properties. Such a data point can be categorized as anomaly data-point.
Anomaly = Deviant = Outliers = Statistical Deviations
Anomalies (or outliers, unexpected behaviour patterns) are variations from expected norms, or from prior data, or from predictions based on process models. The opposite is inliers or non-anomalous data The variations from norms or abnormality may be exhibited in terms of multiple data points or in patterns of data, rather than individual data points themselves. For instance, a customer’s abnormal spending may be indicated by a “collection” of closely spaced purchases, rather than by a “single” purchase.
Visualization of anomaly. Image from WordPress.
Deviant, unusual data points, or anomalous data points occur when data generating processes behave unusually and results in outliers.
Outlier-detection is a well-researched area both in statistical and data science worlds. Anomalies can have two forms:
- Static anomalies (analyzed individually
- Unusual action
- Unusual context
- Temporal anomalies (time based)
- Unusual time
- Unexpected event
- Huge events volume
- ...
Categorization of anomalous data points
The abnormal data points can be categorized further by whether the data being examined is a set, a sequence, or a structure of inherently higher dimensionality, which leads to:
- Point Anomaly:
- One or more data points in the collection are anomalous
- Context Anomaly:
- A data point is anomalous with respect to its neighbors or to other data points which share a context or some features
- Collective Anomaly:
- A collection of possibly similar data points that behaves differently from the rest of the collection.
Supervised and Unsupervised
There are both supervised and unsupervised learning contexts which could be applied to the anomaly detection for the above described scenario.
Supervised:
The training data is pre-labelled or characterized by domain experts, and the task of the anomaly detection is merely involving measuring the variation of new data points from such models.
Unsupervised:
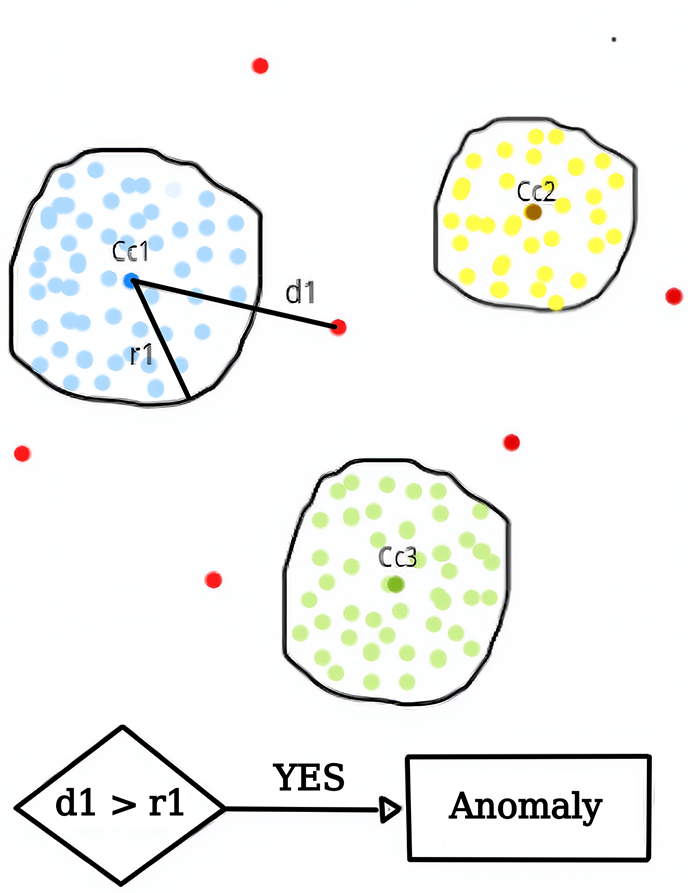
On the other hand are used when the data is not labelled or characterized, because it is a laborious task and / or because of the lack of domain experts. So, there are no prior labels which conclusively distinguish abnormal data points from the normal ones. These algorithms focus primarily on identifying anomalies from a finite set of data points. The distance between two data points are depicted using for instance Euclidean distance or any other distance measure:
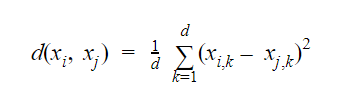
The above distance measure can as well be extended by using clustering methods. By measuring the distance between a data point and a set of data points, such as the average distance between a data point x and all points in S. Data points are often always first clustered for example using k-means clustering. Such a distance measure is then used to identify abnormal data points. The distance between a data point and its k-nearest neighbor is then linearly normalized between 0 and 1. A random point x is then defined to be abnormal if the distance exceeds a predetermined threshold, or among the m highest scores.
Methods categorization
The methods for anomaly detection can be categorized as follows:
Density-based methods
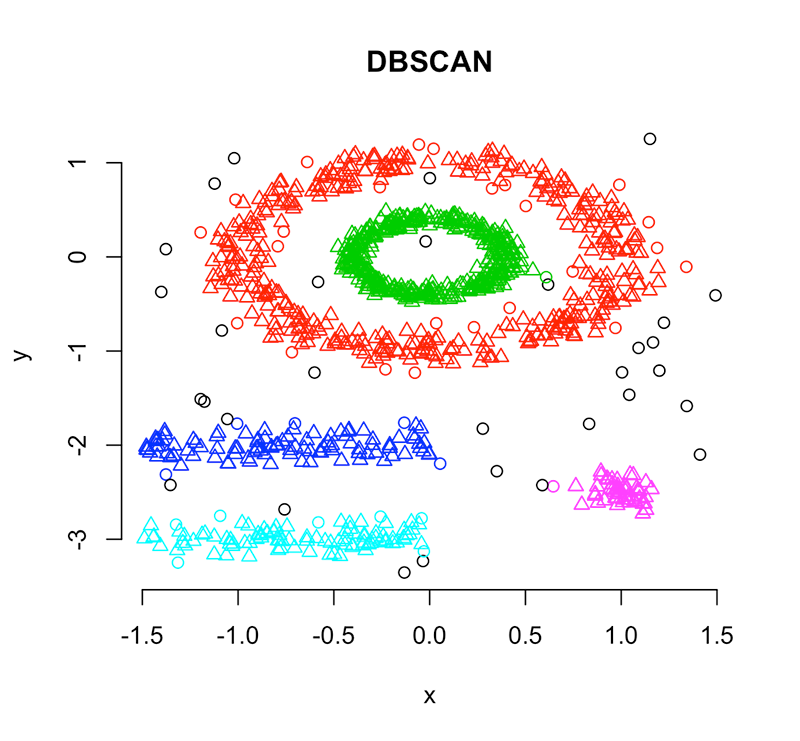
Density based clustering method DBSCAN. Image from researchgate
Density-based clustering refers to unsupervised learning methods that identify distinctive groups/clusters in the data, based on the idea that a cluster in a data space is a contiguous region of high point density, separated from other such clusters by contiguous regions of low point density. The data points in the separating regions of low point density are typically considered noise/outliers.
- DBSCAN (non-parametric - outliers points that lie alone in low-density regions)
- LOF (local outlier factor, local deviation of a given data point with respect to its neighbours).
Distance based
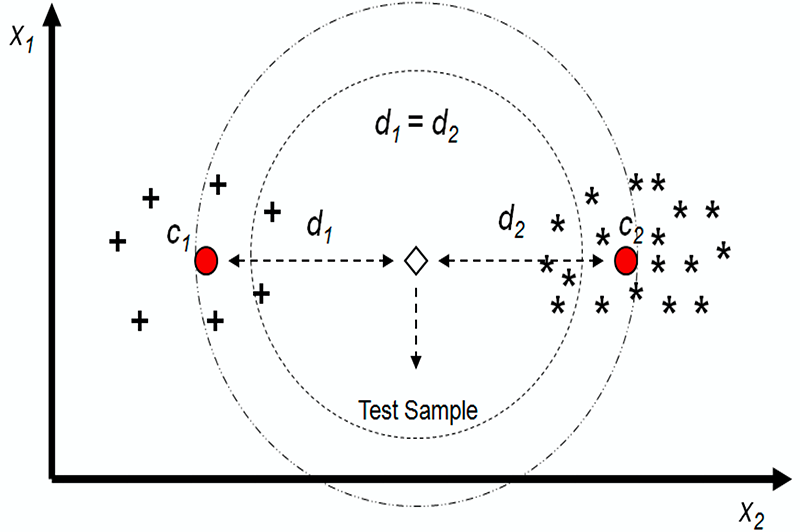
Distance based clustering method. Image from MDPI
Distance based clustering is also an unsupervised data mining and anomaly detection technique used to determine the objects that are similar in characteristics and group them together based on their spatial distance or proximity.
- K-NN (k-nearest neighbors)
- K-Means
Distance to Regression hyperplane (if regression is used)
Both density based and distance based anomaly detection techniques fall under spatial proximity based methods.
Parametric
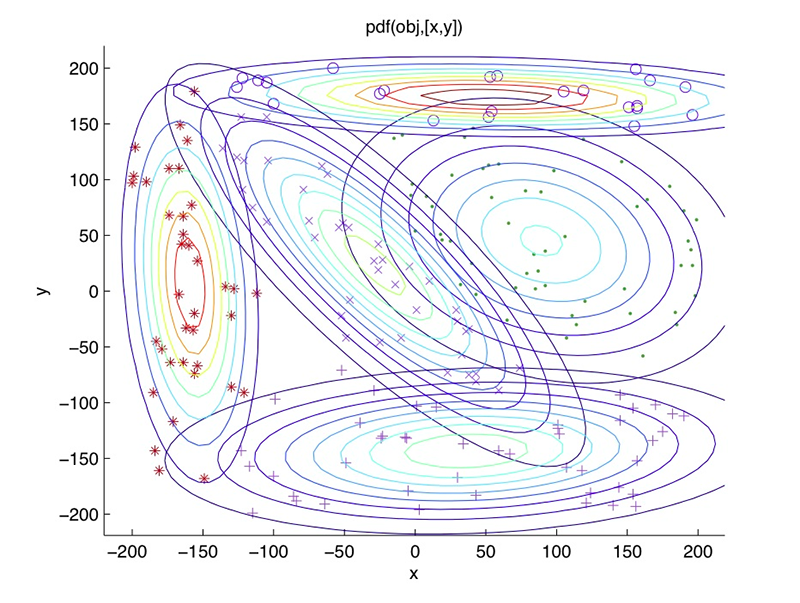
Gaussian mixture model visualization. Image from medium
Parametric anomaly detection techniques on the other hand assume some sort of “form” or shape for the data. If a data-point does not conform to those shapes they are categorized as anomalous.
- GMM (Gaussian mixture model)
- Single class SVM
- Extreme value theory
Others
There are other non-ML based methods as well using for example statistical test approach.
- Statistical tests: Z-score
Isolation Forest Algorithm:
One of the newest techniques to detect anomalies is called Isolation Forests. The algorithm is based on the fact that anomalies are data points that are few and different. As a result of these properties, anomalies are susceptible to a mechanism called isolation.
This method is highly useful and is fundamentally different from all existing methods. It introduces the use of isolation as a more effective and efficient means to detect anomalies than the commonly used basic distance and density measures. Moreover, this method is an algorithm with a low linear time complexity and a small memory requirement. It builds a good performing model with a small number of trees using small sub-samples of fixed size, regardless of the size of a data set.
Typical machine learning methods tend to work better when the patterns they try to learn are balanced, meaning the same amount of good and bad behaviors are present in the dataset
Anomalies can both be positive or good, and also negative or bad or malicious. As much as bad anomalies are destructive and non-profitable similarly good anomalies are productive, profitable and entails opportunity for stakeholders.
Negative anomaly = fraud = money laundering = malicious
Negative deviation or anomalies
Negative deviation or anomalies
Negative anomalies are deviant data-points in the points space which are not only un-normal but also contain malicious intentions. The famous cases in banking and finance are credit card fraud, money laundering and other fraud:
- Retail bank (consumer banking)
- Credit card fraud
- Money laundering through retail Bank
- Private bank (banking to HNWIs)
- Market abuse
- Money laundering through private bank
- Other fraud
- Investment bank (serves govt, corporations & institutions)
- Market abuse
- Money laundering through investment bank
- Other fraud
The way money laundering in these three types are different, therefore different types of detections, approaches and different types of red flags.
Supervised vs. Unsupervised
Automated fraud detection is inherently a different problem then automated money laundering detection and market abuse.
- In credit card fraud, we know what true positives (TP) looks like. How? Customers tell us by themselves. Therefore here in this case we can use a supervised ML approach.
- In Market abuse detection also we often know what the TP look like. How? Positive profit and loss (PnL) and price moves can indicate this. Hence a supervised approach could be used in this case too to detect the anomalous data-point.
- In Automated money laundering detection we do not know whether a data record is TP or not. So it is unsupervised in nature (labelling the data is impractical).
The unsupervised approach to detect the negative anomalies is difficult by nature. The main issues with analytical approach to anti money laundering for example is:
- SEVERE CLASS IMBALANCE - estimated less than 0.1% transactions are categorized manually as money laundering transactions.
- SEVERE CLASS OVERLAP - money laundering is mixed with legal financial activity. Hard to distinguish between the two, good and bad intentions.
- CONCEPT DRIFT - money laundering techniques keeps on changing even by same culprits org. The way ML approaches are evolving, malicious transactions are also evolving.
- UNCERTAINTY AROUND THE DATA MODEL - there is an inherent uncertainty involved around the data model itself. The percent of True Positives (TP) and False Positives (FP).
Automated anti money laundering
It's not a simple anomaly detection problem its not really outlier detection problem.
- Many patterns of transactions associated with money laundering differ little from the legitimate transactions.
- Outliers are often hidden in the unusual local behaviour of low-dimensional subspaces.
- The choice of normal depends on subject matter.
- Risk-based approaches. Focus on the group of high risk clients
Allow a few % of transactions which were tagged/classified as “bad” or malicious transactions. Double benefit from this approach:
- First and foremost the learner will continue learning the new cases, instead of stopping them and eventually “forgetting” them
- And secondly and also importantly reduce the FP cases
Positive Anomalies = Good anomalies = Good opportunity!
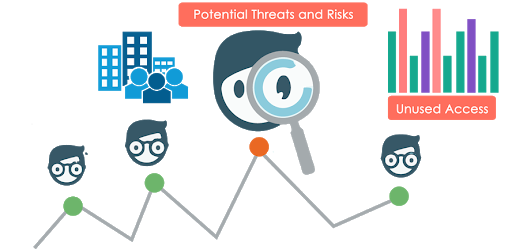
Positive anomalies. Image from elementai
Positive anomalies. Image from elementai
Minority community of good anomalies. The anomalies which are not only deviant but also contain golden opportunity. Humans/machines have a tendency of classifying these good anomalies into “bad” anomalies while failing to successfully classify “good” anomalies. Some of the following cases are not uncommon:
- Withdrawal of huge amounts at once or small amounts regularly
- Deposit/receiving of huge amounts and very small amount regularly:
- The first step is to identify those transactions which are abnormal or outliers. Secondly, predict the occurrence of such an event.
- What causes this event to occur, the reasons:
- Is it because of the time of the year, e.g., christmas etc
- Is it because of the weather change?
- Or totally random?
- The first step is to identify those transactions which are abnormal or outliers. Secondly, predict the occurrence of such an event.
- Changes in the life’s situation:
- New marital status
- Having children
- Needs new loan
- Kids are old enough to live on their own
- ...
Conclusions & discussions
Successful automatic anomaly detection starts with asking the right questions about what is truly unusual and building a set of data models to mimic this: “exploring low dimensional subspaces with flag (maybe red / green)”
How can positive anomalies be turned into opportunities?
Can ML help?
Can I help? Just contact me if you want to discuss further.
References
C.C.Aggarwal, Outlier Analysis, 2nd edition, Springer, 2017. http://charuaggarwal.net/outlierbook.pdf